What is OEE? Understanding Effectiveness in Manufacturing
Read this article to uncover the meaning of OEE (overall equipment effectiveness) and how it is used by manufacturers to reduce waste.


Overall Equipment Effectiveness (OEE) is a standard metric used in lean manufacturing to understand and improve efficiency. This brief article dives into what OEE means, laying the foundation for the next steps of calculating and improving OEE.
The definition of OEE
The book Introduction to TPM: Total Productive Maintenance written by Nakajima and released in 1988 introduced the metric Overall Equipment Effectiveness (OEE). It gave manufacturers a clear reference point for the productivity of individual equipment in a factory and helps improve manufacturing processes.
He later said it should have been called total productive manufacturing because it’s about maintaining the production process in the plant, not just the equipment. Equipment is part of production effectiveness, but OEE can have a broader business perspective by focusing on the entire production system.
Since 1988, OEE has become the gold standard for measuring manufacturing productivity and is used as a key performance indicator (KPI) for production plants, factories, and workshops who are looking to improve.
By pinpointing the percentage of planned production time that is truly productive, OEE provides a multifaceted view of performance, availability, and quality in a single, cohesive metric. OEE gets worse when the machine:
- Has stopped
- Runs slower than max speed
- Makes faulty items (scrap)
In a broad sense, you could look at the OEE process this way.
First, define perfection. How much could you make if you ran a standard product mix every hour of the year, making 100% first-time-right product (with maximum yield), without losses due to changeovers and meetings, at 100% of your maximum demonstrated sustainable rate?
Next, define reality. This is when you look at how much you are actually making.
Then, define your losses. What is driving all of the losses between perfection and reality?
Finally, consider whether the losses are acceptable. Some will be. You will have some planned and unplanned downtime. But are you effectively managing the losses that you have identified? Where the answer is no, this is what you optimize.
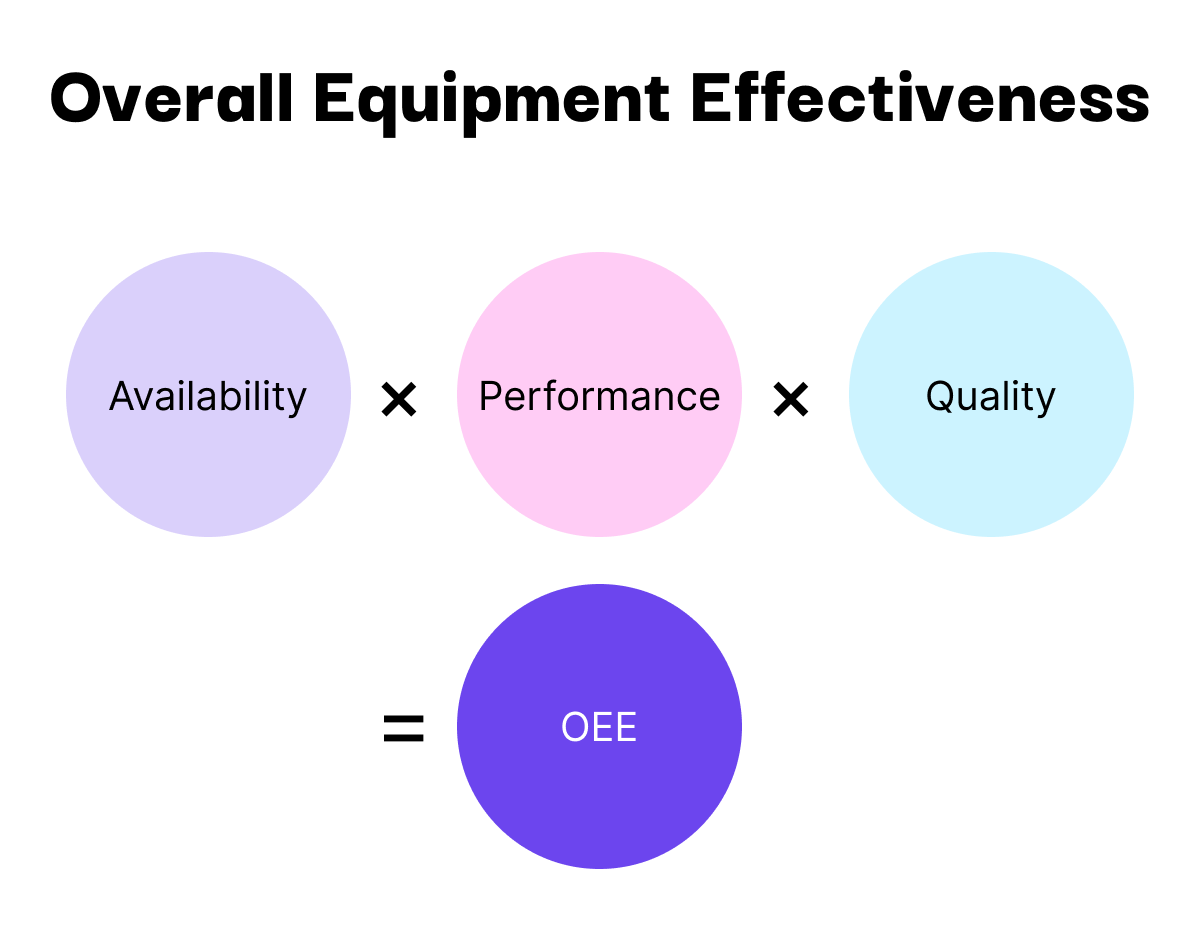
The Three Components of OEE
Typically, lean manufacturing specialists calculate OEE as the relationship between three components: performance, availability, and quality.
Availability focuses on the planned production time and how effectively it is utilized. According to Nakajima, it considers downtime events that halt production, allowing an insight into overall operational availability. But this can differ between OEE calculation methods.
Performance measures the speed at which the manufacturing process operates compared to its maximum potential. It helps in identifying whether more products could potentially be produced during the allocated production time.
Quality assesses the number of products meeting the quality standards against the total number produced. This component is crucial for understanding the waste generated due to defective products.
The Importance of OEE
Understanding OEE helps you unlock the hidden potential of manufacturing processes. OEE’s comprehensive overview of how well manufacturing operations are running helps organizations to:
Identify Weaknesses: OEE allows manufacturers to pinpoint areas of inefficiency and waste, unveiling opportunities to enhance production and mitigate losses.
Optimize Productivity: The insights derived from OEE help manufacturers make informed decisions, streamline processes, and optimize machinery utilization, which, in turn, bolsters productivity.
Improve Quality: By focusing on the quality component of OEE, manufacturers can optimize their processes by increasing units produced and reducing waste.
Increase Profitability: Enhanced productivity and quality, coupled with reduced waste and downtime, lead to increased profitability, allowing organizations to stay competitive in the ever-evolving manufacturing landscape.
OEE is both a tactical and strategic metric:
- Tactical: OEE allows you to identify and minimize day-to-day and week-to-week losses.
- Strategic: OEE helps you identify potential capacity for future expansion.
For example, OEE can help you evaluate whether or not to invest in new equipment. If your production lines are running under capacity, say with an OEE of 50% when the average for similar operations is 65%, then you know that optimizing your existing equipment would make a lot of sense before throwing more equipment at it and increasing costs.
OEE software does the heavy lifting of taking your data and turning it into actionable metrics. You can read a detailed overview of how to calculate OEE in this blog post: How to calculate OEE.
OEE Excellence Levels
Once you start measuring OEE either manually or, more effectively, automatically, you will have a baseline on which to improve manufacturing processes.
With a data-driven approach on shop floors, you will go through stages of implementing and improving OEE.
Excellence level 1 = Tracking live flow by the minute
You will now understand:
- When you start and finish
- How much you’ve produced
- The number of stops and total down time
- Average stop times
- The longest non-stop production period
- Product cycle times
- Trends and averages
At this stage, live flow monitoring gives you an overview of value adding time. So, even without reducing stop causes and targets, you have a simple understanding of OEE.
Just getting started? Read our easy guide to collecting and analyzing data on shop foors: 5-step guide to manufacturing data implementation.
Excellence level 2 = Analyzing Down Time
You now have:
- The reasons for downtime and stops
- The biggest stop causes
- Change over times
- OEE 1, OEE2, OEE3, and Total Capacity Utilization
- Operator comments
- Visualizations of individual stop causes over time
For success at this stage, you will need buy-in from operators for them to start registering stop causes on a daily basis. Otherwise, you’ll need to start auto stop registration immediately by tapping into machine controller tag data.
Read our guide on OEE implementation to get more insights on how to set stop causes and stop categories: How to implement OEE.
Excellence level 3 – Target setting
Target setting involves:
- Setting targets for products
- Setting time targets for batches
- Setting volume targets for shifts
- Visual tracking of actual performance vs targets
Target setting and monitoring goes further than OEE and is not easy. Do you already know if you are behind or ahead by shift, batch, or product? You are quite advanced if you already can say yes, because here you need to know cycle times and expected speeds as well as the actual amount produced.
When you are able to monitor production by batch or workorder, you can also analyze OTIF (On Time In Full), a very commonly used metric in manufacturing.
Improve your Overall Equipment Effectiveness with Factbird >
OEE improvements
If you’ve gone through the three stages of OEE excellence listed above, you now have a strong base of data and analysis for improving OEE.
Now you can identify the biggest stop causes, increase production throughput, reduce scrap, and more based on transparent metrics. For example, a classic continuous improvement pareto chart will help you identify the 20% of issues that cause 80% of production problems.
To find out about how to use OEE analysis to improve production, read our full guide on improving OEE in this article: How to improve OEE.
A productivity barometer
Serving as a barometer for manufacturing productivity, OEE assists organizations in identifying areas that are ripe for improvement, enabling them to elevate their operational efficiency and, consequently, their profitability.
If you would like to get started measuring OEE or get more out of your improvement processes, get in touch with the Factbird team for a no-obligations chat.

