6 Tips for Successfully Implementing OEE
Manufacturers can benefit greatly from accurate OEE measurement. Get started with these six OEE implementation tips and successful case study examples.


Navigating the implementation and improvement of Overall Equipment Effectiveness (OEE) is crucial for manufacturers aiming to boost productivity and sustainability.
This article covers practical strategies to help you implement and improve OEE for sustained manufacturing excellence and profitability.
Now let’s take a look at some best practices for implementing OEE.
1. Define OEE Components
Implementing OEE begins with clearly defining its three key components, typically defined as:
- Availability measures the uptime of the machine.
- Performance evaluates the speed of operation compared to the validated speed.
- Quality assesses the ratio of good parts produced to the total parts produced.
Defining these components accurately and consistently across the organization lays the foundation for meaningful OEE measurements.
You can read more about the three components of OEE here: How to Calculate OEE.
2. Standardize for Effective Comparison
A big problem when implementing OEE is that different factories or areas within an organization don't all use the same standards. They have different definitions of downtime, performance speed, and quality defects, which makes it hard to accurately compare OEE scores.
To fix this, it's vital that you create a standard definition for OEE and its parts that everyone in the company uses. This definition needs to be communicated and put into practice in all work areas so that everyone measures equipment effectiveness in the same way and works to improve it consistently.
Improve OEE with best-in-class OEE software >
3. Define Stop Categories and Stop Causes
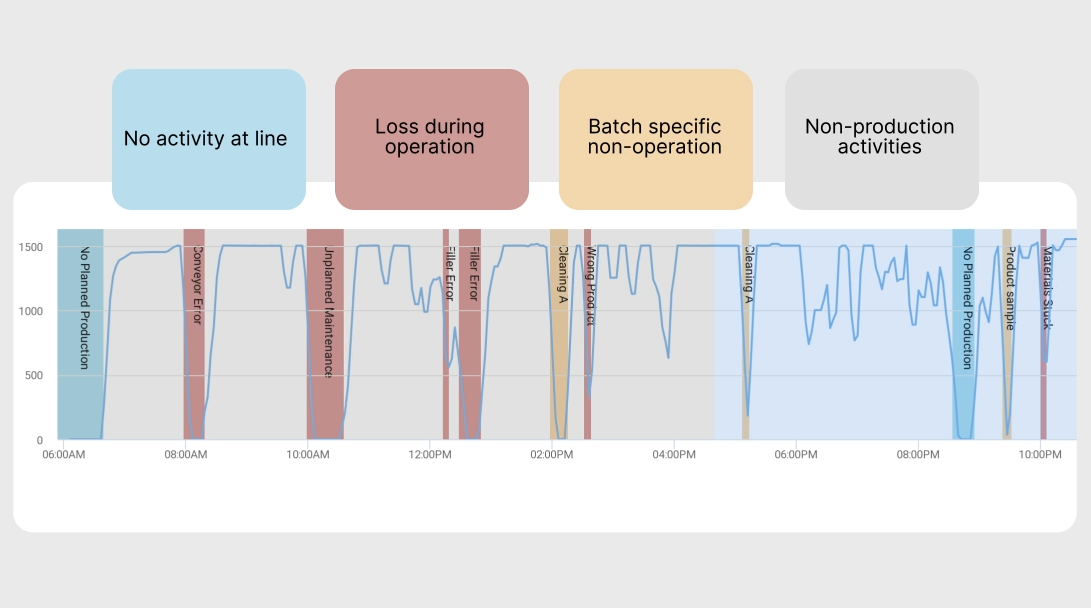
A vital aspect of implementing OEE is defining and registering stop categories and stop causes. These categories represent the events that lead to downtime in your manufacturing process, while the causes pinpoint the specific reasons behind these events. By carefully defining and categorizing these stops, you can gain actionable insights to drive OEE improvements effectively.
Start Simple, Scale Smart
At Factbird, we suggest starting with maximum 20 main stop causes. By starting with basic categories like "material jam," you keep operators engaged, don’t disturb their work, build good habits, and record useful information. You can download our stop causes template here to get started: Download the OEE Stop Causes Excel Template (direct download).
Refine with Experience and Data
As your organization gains experience and accumulates data, you can refine your stop causes by breaking down the initial high-level categories into more specific causes. For instance, you can further delve into "material jam" subcategories such as "label jammed on roll," "cardboard jammed in folder," or "product stuck in extruder." This level of granularity allows for a more precise understanding of the root causes behind stoppages.
Align with OEE and TCU Classifications
To gain a comprehensive view of the factors impacting your OEE, it's crucial to align your stop causes with OEE and TCU classifications. This involves categorizing each stop cause according to whether it falls under operational losses (OEE1), batch changeover losses (OEE2), non-production activity losses (OEE3), or periods of no activity at the line (TCU). This classification provides a nuanced perspective on the different dimensions of your OEE and enables you to take targeted actions to improve specific areas. You can read more about this in our article on calculating OEE.
Unlock Actionable Insights
By defining stop categories and causes, you gain valuable insights into the downtime events occurring within your manufacturing process. This allows you to identify patterns, trends, and recurring issues that impact your equipment's effectiveness. Armed with this knowledge, you can develop data-driven strategies and take proactive measures to reduce downtime, improve performance, and enhance overall productivity. The actionable insights derived from well-defined stop categories and causes serve as the catalyst for operational improvements that propel your organization toward OEE excellence.
4. Collect Data and Analyse
After defining the OEE components and establishing a standard definition, the next step is to collect relevant data.
Using innovative tools such as Factbird, the world’s leading plug-and-play manufacturing intelligence solution, will simplify data collection, enhance accuracy, and improve efficiency.
Capturing data related to machine uptime, production speed, and quality metrics allows for the calculation of OEE scores. This data serves as a foundation for identifying areas for improvement and making informed decisions.
Read more about how to get started with data collection on shop floors here: 5-Step Manufacturing Data Collection Guide.
5. Identify Areas for Improvement
The main benefit of using OEE is that it helps you prioritize areas where you can improve.
You can use the OEE categories to identify the specific areas that need attention and where the biggest gains can be made. Then you can create action plans to make things better. This will help you make the most of your equipment and reduce waste, leading to greater productivity.
6. Continuous Improvement Culture
Implementing OEE is not a one-time activity but an ongoing process. Organizations committed to operational excellence foster a culture of continuous improvement. This involves regularly reviewing and refining OEE measurements, analyzing trends, and identifying opportunities for optimization.
By embracing a data-driven approach and continually involving colleagues in the improvement process, you will drive more sustainable improvements, empower teams, and achieve greater operational excellence.
OEE benchmarks
In reality, it's impossible for any process to reach 100% OEE (aka "perfect production"). Here’s a quick rundown of why:
- 100% Availability is only possible if equipment is always running during the planned production time, meaning no delays in shifts, perfect availability of raw material, no stop causes, etc.
- 100% Performance would mean equipment is always running at the theoretical maximum speed, known as Ideal Cycle Time.
- 100% Quality is the same as achieving zero production of defective goods. Every single piece produced must be perfect.
Manufacturers typically aim for a range of 80-95% OEE, a score that is seen as excellent, but this can vary greatly depending on the industry.
Typically, an OEE score of around 60% is seen as good but has room for improvement.
While it is important to strive for the highest possible OEE score, it's also crucial to consider realistic production capacity and avoid overestimating potential.
OEE Implementation Case Studies
Get inspired by OEE success stories from manufacturers who have successfully implemented OEE measurement systems and made significant OEE gains.
Sintex
Sintex is a high-tech component manufacturer from Denmark that rolled out the Factbird® DUO solution. They started slowly by installing Factbird's IIoT gateways on 10 of their machines. Factbird's IoT functionality and flexible connectivity options made it the perfect solution. They have since expanded Factbird to 30 of their machines.
After installing the Factbird® DUO, it was an instant eye-opener for us. We didn’t know the system would have such positive effects that quickly... We had many small stops which were hard to see before Factbird, but we realized these stops had a larger effect on production than the longer stops.
Casper Levorsen - Production Technician at Sintex A/S
With Factbird, Sintex was able to identify which stop causes were most urgent, and as a result, they were able to make quick, fact-based decisions that led to an increase in efficiency of 5% within the first week.
Royal Unibrew
Royal Unibrew is an international brewery headquartered in Faxe, Denmark. Recognized as the second largest beer company in Denmark, with a strong presence in the Baltic countries. Brands included in Royal Unibrew’s portfolio are Faxe, Ceres, Royal, Albani, Vilniaus Tauras, and Kalnapilis. Watch the video to understand how they rolled out Factbird's OEE measurement solutions.
