How to calculate OEE
In this article, we introduce the OEE formula, break down it’s three components, demonstrate how to calculate OEE, and provide an OEE calculation example.


Manufacturers who don't prioritize continuous improvement and data-driven decision-making are falling behind and losing market share to more efficient rivals with lower costs or more efficient production lines.
Most manufacturers already recognize the importance of data and aim to be leaner with help from Overall Equipment Effectiveness (OEE), a key performance indicator for improving production processes.
OEE calculation and analysis is an effective way for manufacturers to find new efficiencies, as it clearly identifies areas that require attention.
In this guide, we will look at two methods for calculating OEE, the original process as described by Nakajima and the modern OEE process that Factbird uses.
There are multiple OEE calculation methods
There are multiple ways of calculating OEE, with adjustments made to the definition of losses and the allocation of stop-causes depending on industry, use case, and individual preference.
In Introduction to TPM: Total Productive Maintenance, Nakajima introduced the original OEE concept. Originally, Nakajimi focused on planned production time and did not encourage the inclusion of factors like planned maintenance and planned changeovers. Since then, manufacturers and lean specialists have put forth new OEE calculations that capture more losses and are better suited modern manufacturing processes.
Let’s look at OEE calculation according to Nakajima followed by the OEE technique used by Factbird and leading manufacturers worldwide.
The Nakajima TPM OEE calculation
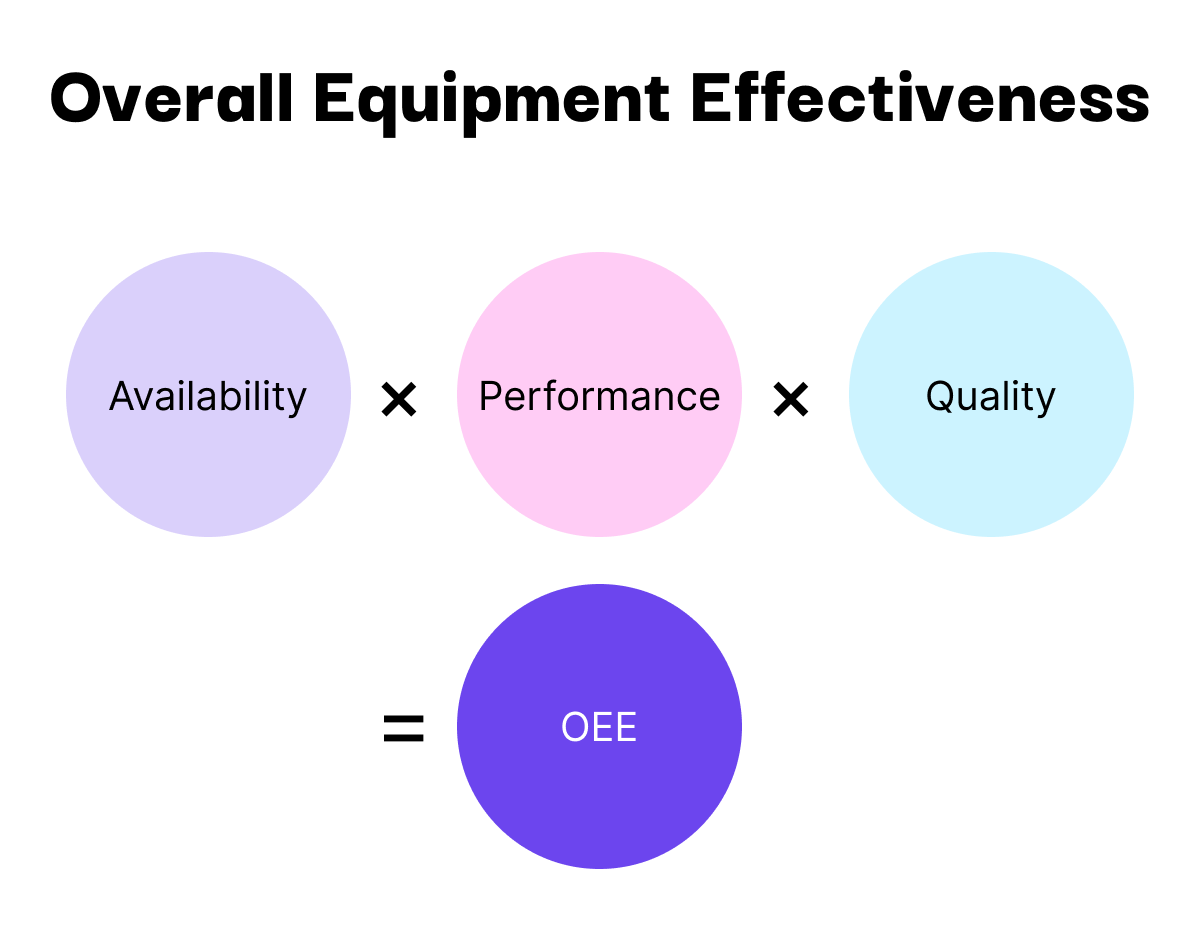
OEE is a measure of total equipment performance used to identify losses and improve total asset performance.
The standard OEE formula put forth by Nakajima looks like this:
Overall Equipment Effectiveness (OEE) = Availability x Performance x Quality.
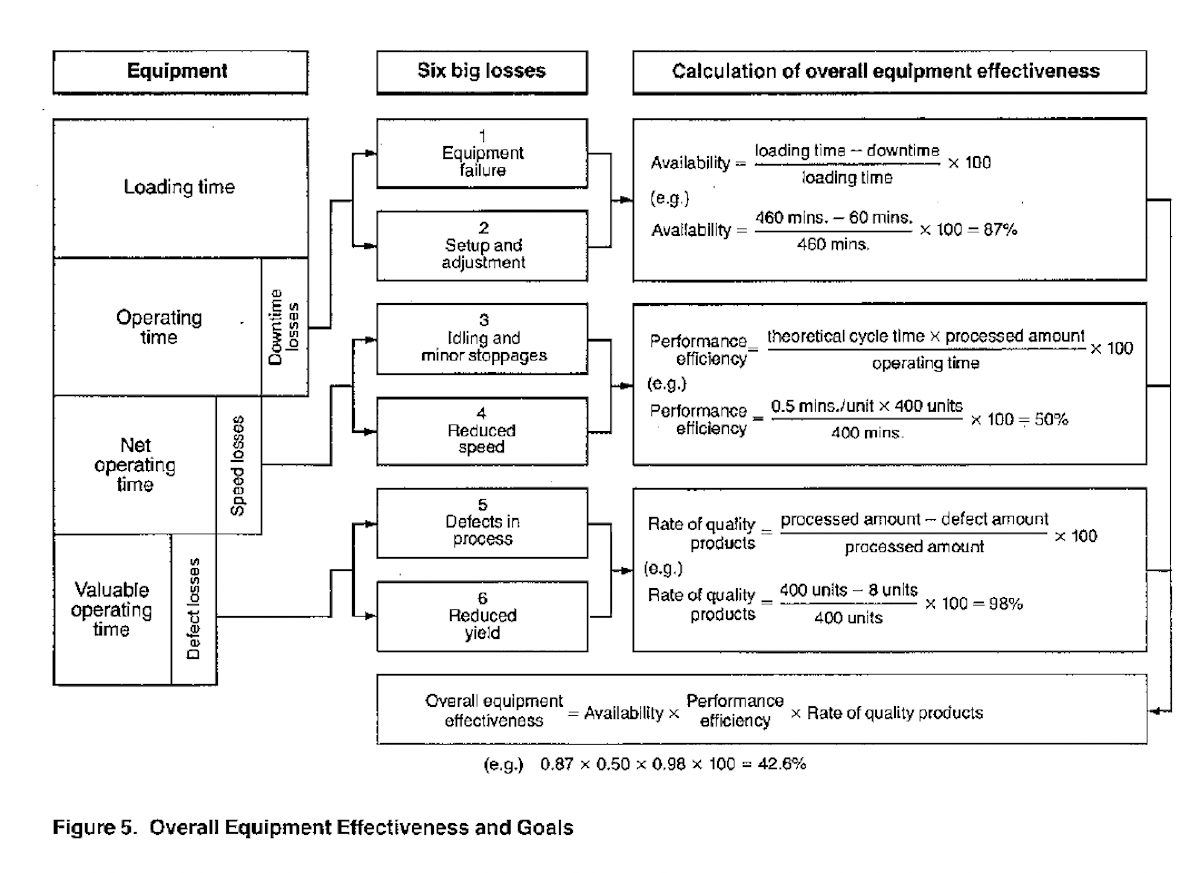
OEE Component 1: Availability
According to Nakajima, Availability is affected by downtime losses:
- Equipment failure
- Setup and adjustment
Here’s how to calculate the Availability rate in OEE according to Nakajima:
- Availability rate = (Operation time / Loading time) x 100
Loading time is often called the Planned production time for extra clarity. It’s important to note, that planned production downtime (such as cleaning and team standup meetings) is excluded from Operation time.
Here, Operation time is:
- Operation time = Loading time (aka Planned Production Time) – Downtime
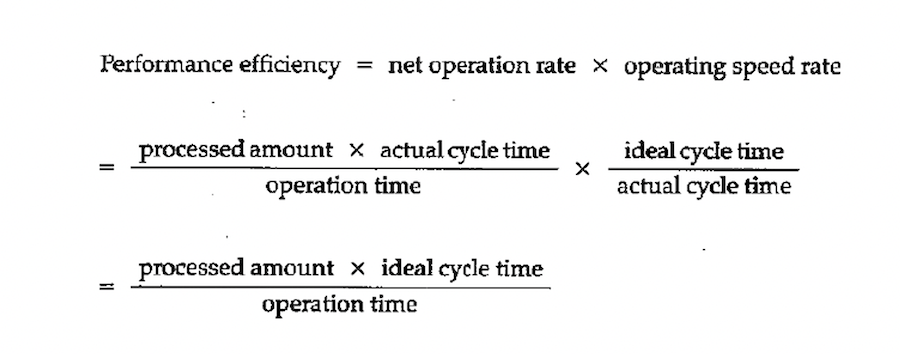
OEE Component 2: Performance
Performance efficiency is affected by speed loses:
- Idling and minor stoppages
- Reduced speed
Performance efficiency can be defined as the operating speed rate (ideal cycle time / actual cycle time) multiplied by the net operation rate ((processed amount x actual cycle time) / operation time).
This calculation therefore takes into account the discrepancy between the ideal speed based on the equipment’s design and its actual operating speed.
Here’s how to calculate the Performance efficiency:
- Performance efficiency = ((Ideal cycle time x Processed amount) / Operation time) x 100
OEE Component 3: Quality
The final component of the OEE calculation is Quality, which measures the amount of production throughput that meets the required specifications compared to the total amount of production throughput.
For quality losses, we have two categories:
- Defects in process (e.g. equipment that requires warm-up time causing defects until it reaches a steady state)
- Reduced yield (here, quality aims for “Right First Time” production)
Here's how to calculate the Quality rate in OEE:
- Quality rate = ((Processed amount – Defect amount) / Processed amount) x 100
Also expressed as:
- Quality rate = (Right First Time / Total Production) x 100
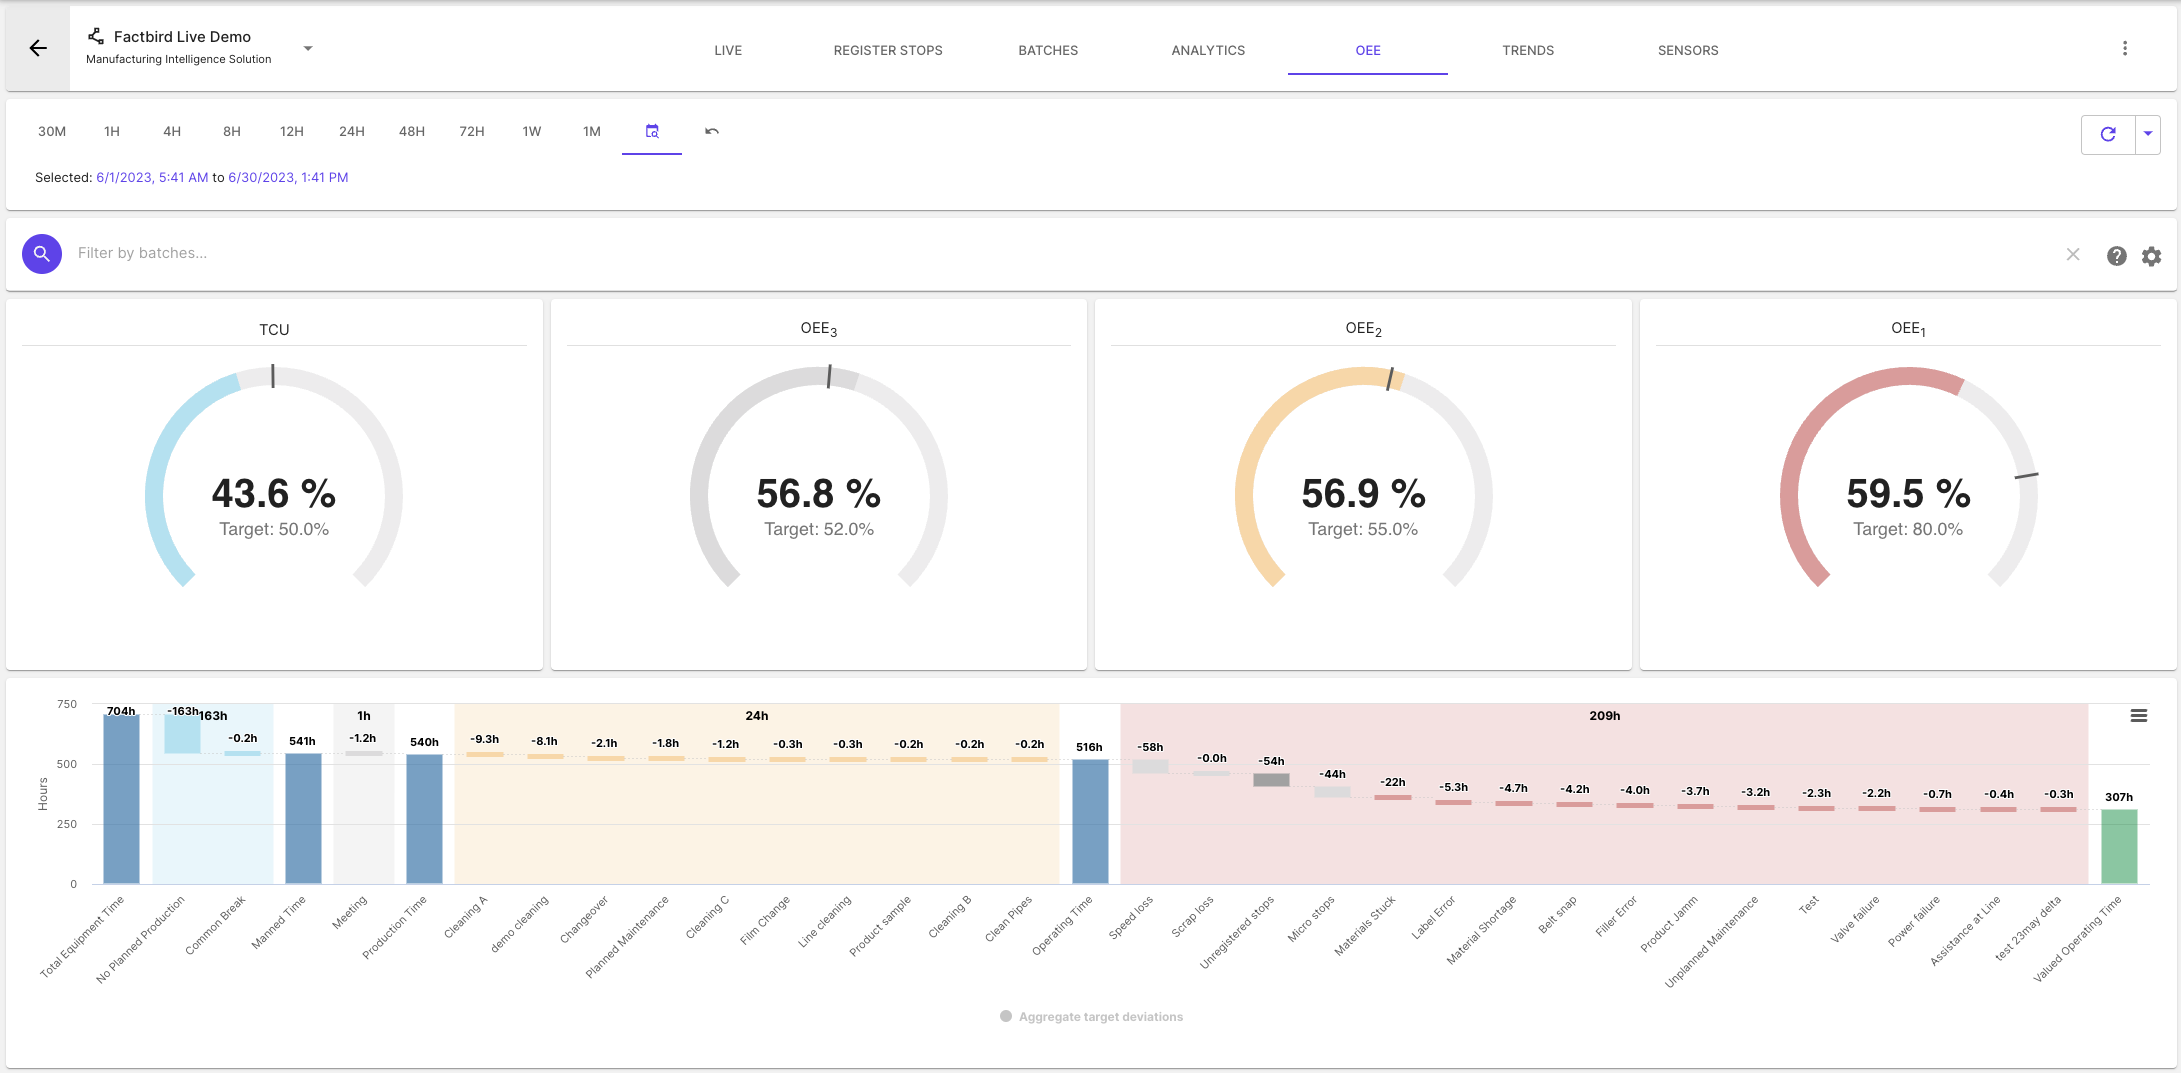
Factbird’s OEE Waterfall
Let’s look at how Factbird helps manufacturers reach their OEE goals using the waterfall approach for OEE.
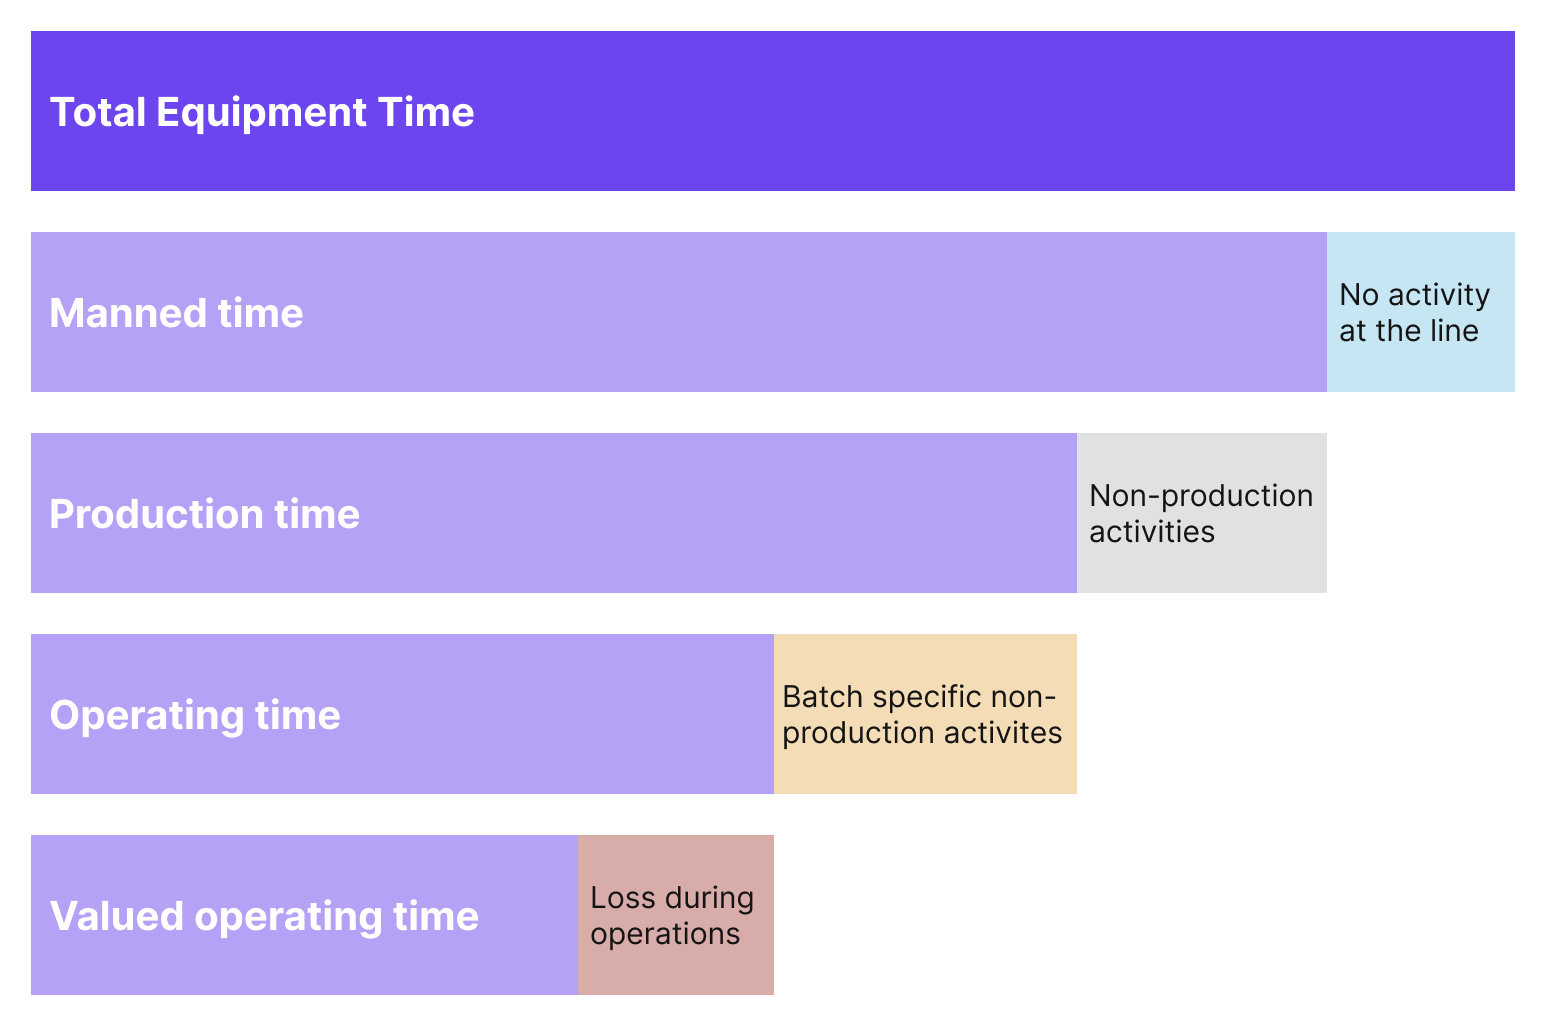
As you can see, we add another level to the Nakajima calculation of OEE that helps us take planned downtime into account, called Total Equipment Time (the plant’s total potential operation time).
This means that manufacturers can still separate out unmanned non-production time due to a lack of orders or only having one shift a day, for example.
You’ll find that it’s easier to spot bottlenecks and stop causes that have the greatest impact on efficiency using the waterfall approach compared to the formula approach.
OEE1 vs OEE2 vs OEE3 vs TCU
Total Capacity Utilization (TCU), takes into account planned downtime, due to vacations, breaks, or simply no planned production.
OEE3 accounts for all the planned maintenance work. Usually, this time is allocated during weekends, as lines only run for a third of their average run time, according to the schedule. We call this Non-production Activities.
OEE3 stop causes examples:
- Planned maintenance
- Quality inspections
- Personnel activities (i.e., meetings, training)
OEE2 is associated with the time that a production line is not running due to batch changeovers, resupplies, and cleaning. Although these stops are planned, they take a significant amount of time from the total available time. We call this Batch Specific Non-operation.
Potential OEE2 stop causes are:
- Batch Changeover (i.e., preparation, re-tooling, etc.)
- Resupply (i.e., material, packaging, labels)
- Cleaning (i.e., end-of-shift cleaning)
OEE1 is associated with the actual expected run time. This value is linked to unplanned stops or slow cycles. OEE 1 covers the downtime, cycle time, and production waste/scrap. We call this Loss During Operation.
Potential OEE1 stop causes are:
- Machine defects
- Process defects
- Waiting time (i.e., materials, operators)
- IT-related causes
- Unplanned cleaning, e.g. after a defect
Factbird's OEE monitoring system
You can watch the video below to see a demo of OEE1, OEE2, OEE3, and TCU in action.
An OEE calculation example
Let’s put what we’ve explored so far together now with an OEE calculation example using Factbird’s OEE methodology.
Total Equipment Time
- 7 days of 24 hours = 168 hours
Availability Losses
No activity at line:
- Non-scheduled hours = 56 hours
Non-production activities:
- Planned maintenance = 8 hours
- Validation of equipment = 4 hours
- Testing new products = 2 hours
Batch-specific non-production activities:
- Changeover and setup = 17 hours
- Daily cleaning = 7 hours
Availability rate = 74 / 168 = 0.44
Speed losses
- Validated maximum speed = 240 pcs / min
- Actual speed = 161 pcs / min
Performance rate = 161 / 240 = 0.67
Quality losses
- Batch size = 100,000 pcs
- Scrap per batch = 5,000 pcs
Quality rate = 95,000 / 100,000 = 0.95
You can then put all of this together to get Total Capacity Utilisation:
TCU = 0.44 x 0.67 x 0.95 = 28%
When calculating TCU, OEE3, OEE2, and OEE1, the same data will look something like this:
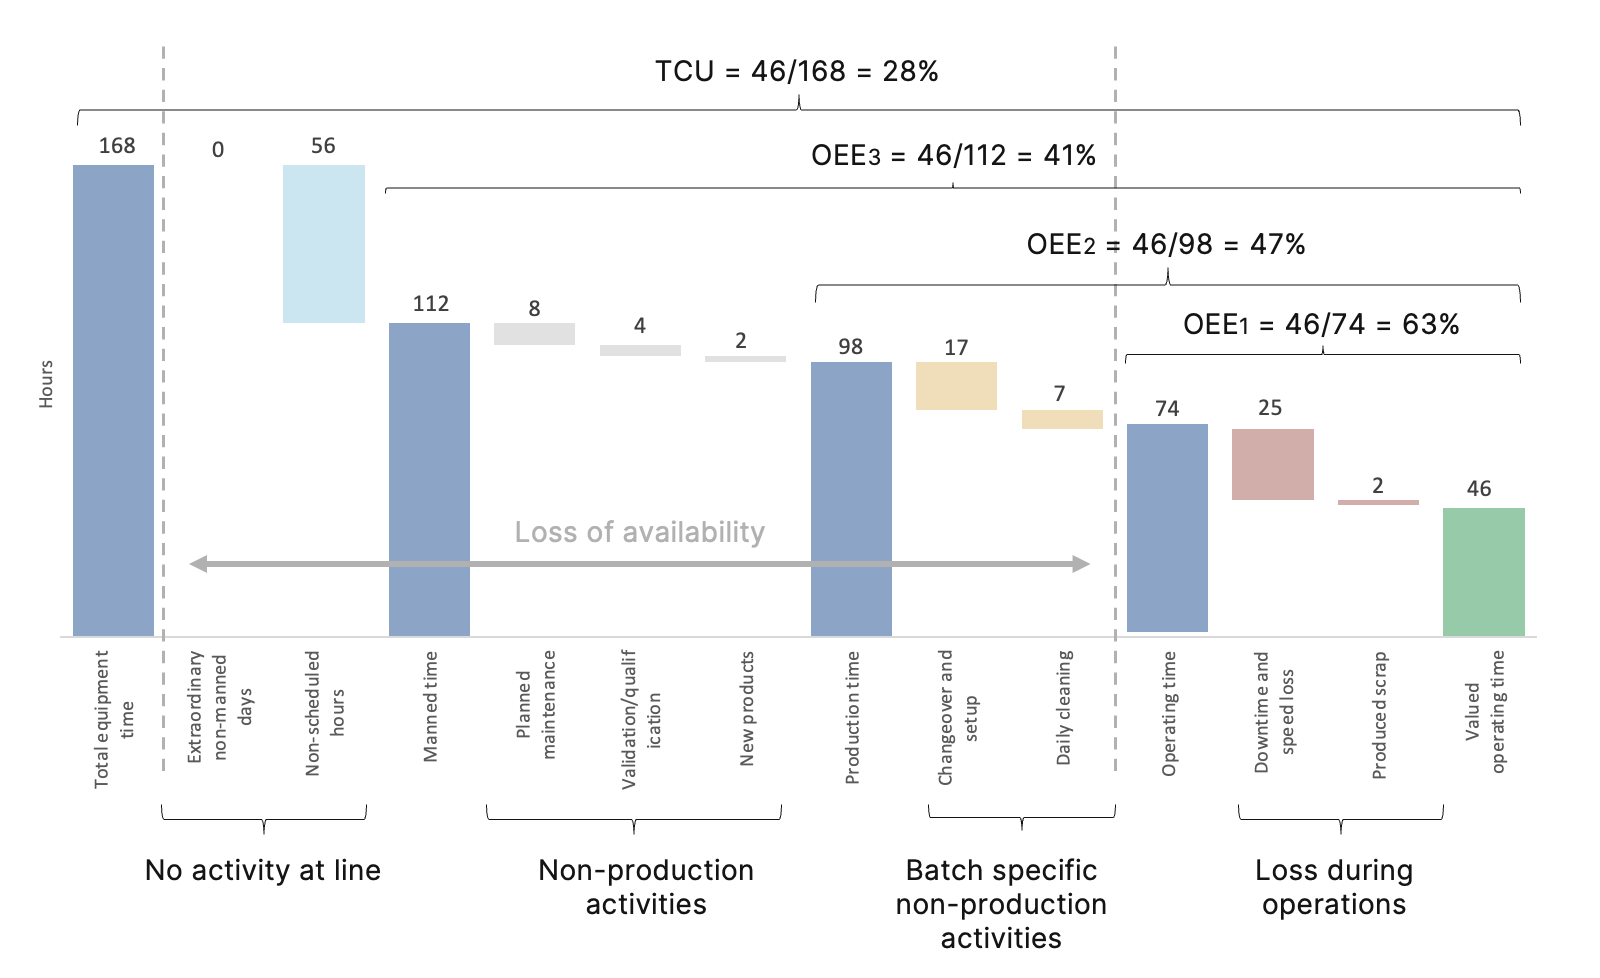
Note that "Loss during operations" has been calculated as time losses in the waterfall calculation as opposed to unit-based scrap and quality losses. This is a good example of different calculation methods leading to the same result.
Common issues for OEE calculations
Although Factbird’s manufacturing intelligence solutions are easy to set up and quickly deliver precise OEE calculations, there are some common issues that creep in at each stage of the calculation.
- Excluding too many stops: Microstops build up more time than we typically estimate, so it's important to analyze them as a whole so we can better prioritize areas for improvement.
- Ignoring or underestimating changeover time: You might estimate 30 minutes for changeovers that take 40 minutes or more. These estimates quickly accumulate and represent large miscalculations in production availability.
- Underestimating the ideal production speed: To solve this potential issue, manufacturers ought to consider the specified validated speed by machine manufacturers’, or work with the highest recorded speed in the plant.
- Forgetting to exclude rework: Remember to exclude throughput that needs rework from Right First Time counts. It’s in the name but can easily be missed.
- Inaccurate scrap counts: The most common issue when measuring Quality in OEE is scrap counting. It’s typically a time-consuming process performed by operators and prone to human error.
Fortunately, solutions for these problems can be found thanks to modern solutions and professional change management services.
Take scrap counting, for example. You can track scrap automatically when pairing IIoT data collectors like Factbird® DUO with a sensor. You can read about this in our Erwin Quarder Group case study where we show that scrap monitoring can reduce scrap rates thanks to accurate information about scrap causes.
Start measuring OEE ASAP
As we have seen, OEE is a metric that manufacturers use as an effective standard of efficiency in manufacturing. Ensuring we get accurate calculations and deep analysis of OEE is the first step toward improving production performance.
If you are in doubt about how to get started collecting data on shop floors, check out our 5-step Guide to Manufacturing Data Collection.
We hope this OEE calculation explainer helps you calculate OEE on your own production lines. If you feel like you need help getting started or have any questions about measuring OEE on shop floors, just reach out to us for a no-obligation chat.